

Stock Market Cycles Update - March
Stock Market Cycles Update - March
Equity markets will face a variety of negative cyclical factors in the weeks ahead

This article does not comment on the latest financial chatter from the mainstream media and financial analysts. One gets the feeling that media and financial analysts currently have no answer to anything at the moment.
» This post will deal solely with dynamic time-cycle analysis.
Recap:
Mid-March has always been the predicted window of opportunity for the cycles to move from their short upward phase that began in late December and now into the bearish camp. Therefore, this update based on the latest data does not contain a fundamentally new forecast but a confirmation of the cycles already shown. Hence, knowledge of the previous analyses is helpful and I would like to refer you to the previous contributions.
Here is the short summary from the February update:
“The final low may not yet have been reached […] short-term daily cycles have exceeded their positive momentum […] by March at the latest, daily cycles are turning negative […] The technical cycle-tuned indicators are showing sell signals. The period until March could thus usher in a further downward movement.”
Source: Feb. Cycles Update: 1
So securing any long position from that day (Feb. 12) was already the right decision to not longer ride the upswing. So far, so good. Whats next? Here is the most important bottom line of the time cycles ahead of us into late summer:
» Now we are reaching the next point in time where a confluence of long-term and daily cycles in downward phases will be the predominant condition.
Let’s get back to the cycle analysis desk and review the current time cycle status.
» Technical chart update
First, I will start with the technical situation using my two favorite cyclic-tuned technical indicators. I highlighted in the February post that it is the second time since the major top in Nov. 2021 that a sell signal was issued based on the long-term cycle. These are very rare situations. This signal from Feb. is updated below and still valid. The cyclic momentum also made a top in the lower panel and is turning down now. The technical situation has now room for the price to move lower until the next signal will be issued.
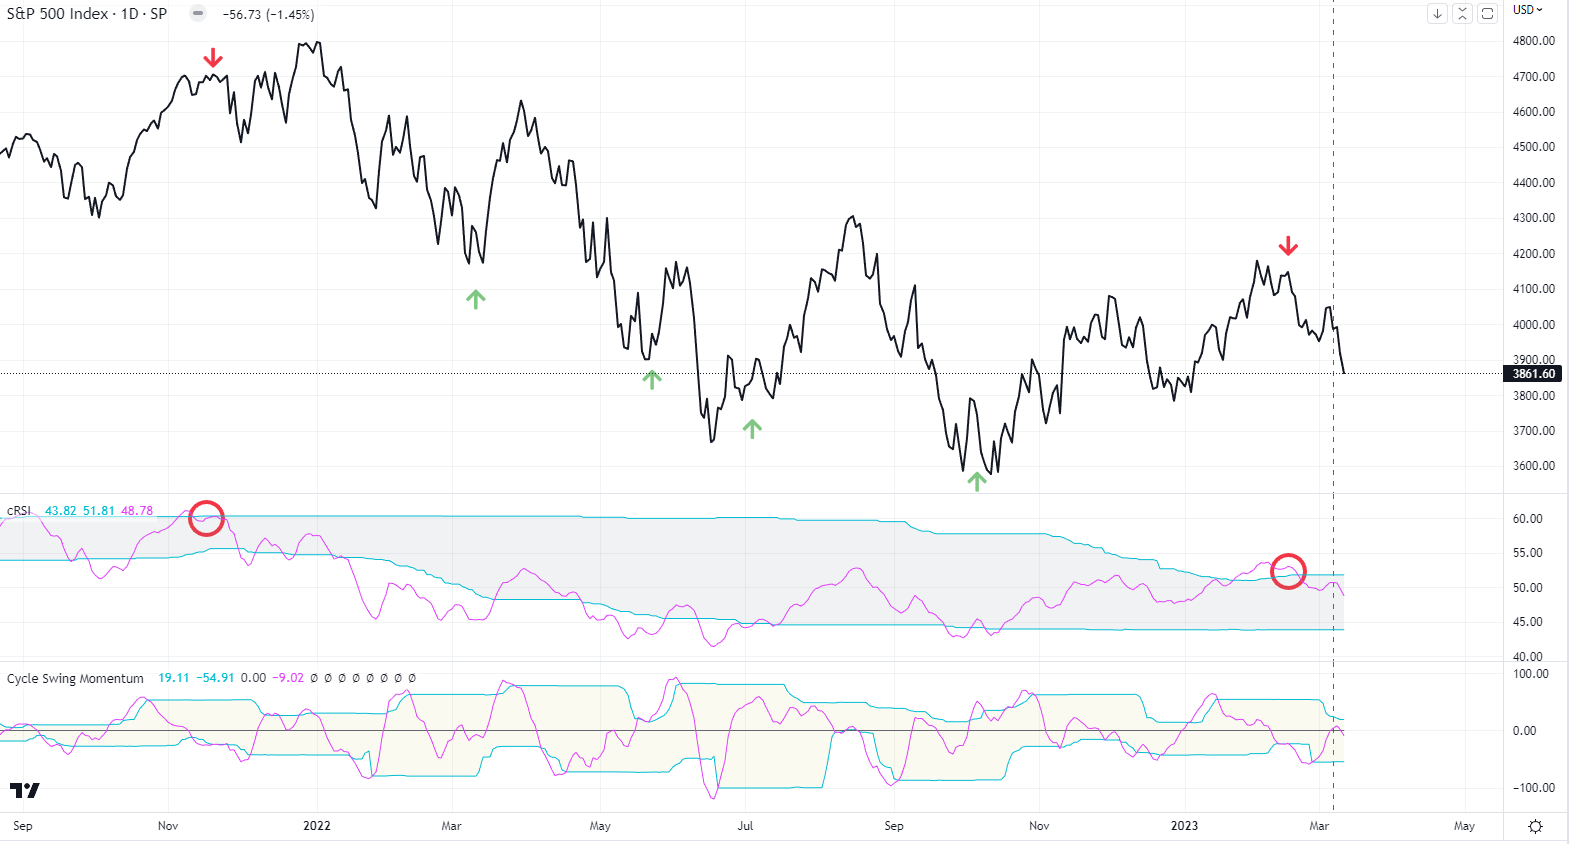
» Daily SPX Cycles Update
The S&P 500 index cycles have now both switched to their negative downward phases. Starting to turn down now as anticipated by last updates.
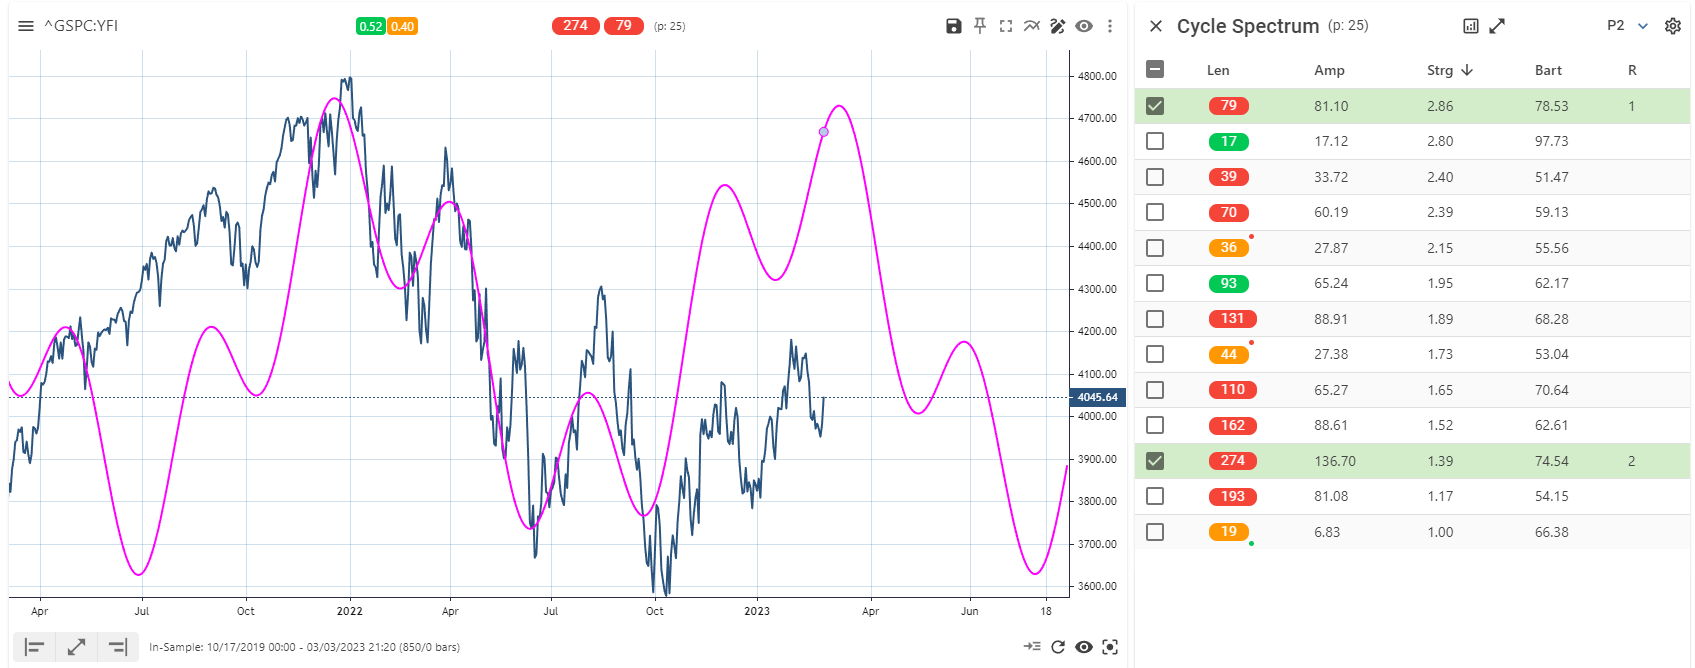
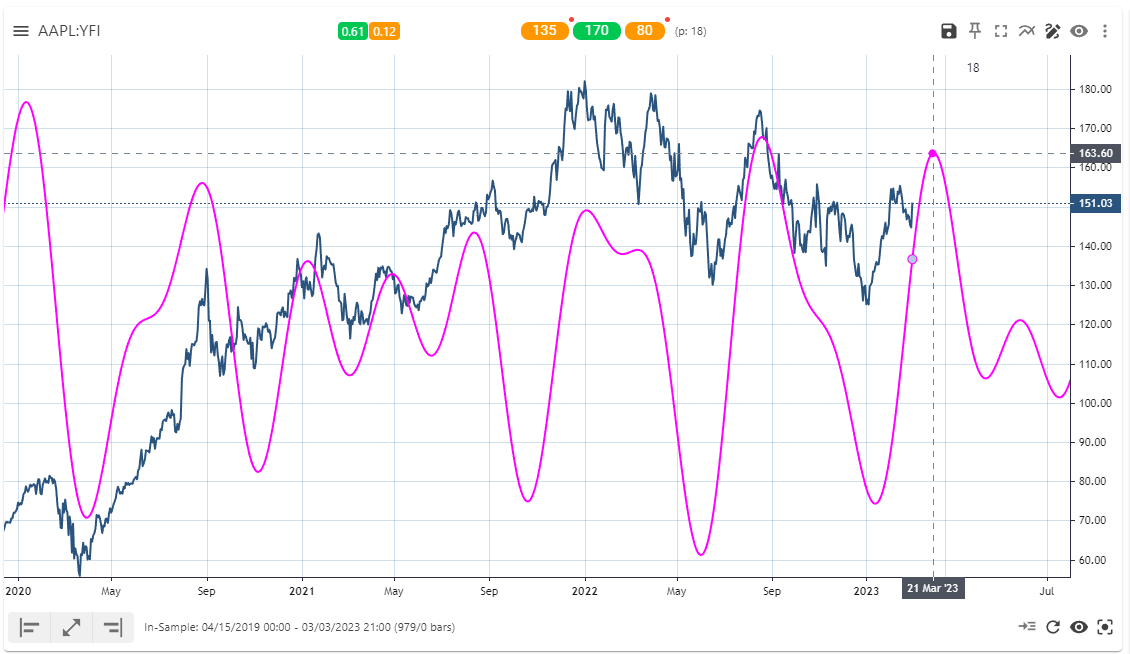
As we used Apple as a proxy to monitor cycles in the tech sector, lets review the current state. This model helped us to project the bottom at the end of 2022 since mid 2022 and the upswing for January. Now the previous projections predicted the top for March. Lets see if this is still the case with using latest price data.
» Apple Composite Cycle Model Update
The composite cycle top projection has not changed compared to our earlier composite models. Projecting down into late summer.
You might be aware that we also follow the weekly long-term cycles model. The long-term SPX model is till waiting for the major bottom to arrive. But today, lets use another weekly data series for a long-term update. I like the St. Louis Financial Stress Index as a kind of sentiment index on the weekly time scale.
» Financial Stress Composite Sentiment Cycle
St. Louis Fed Financial Stress Index with cycle analysis and composite cycle model overlay. Using dominant 192 and 54 weeks cycle. Cycle extreme turning points correlate to major market turns (extreme sentiment stress top = market bottom and vice versa). Now in approaching final topping sentiment stress window due late summer (first top) or early April 2024 (second top). [reading = financial market bottom late summer or early 2024)

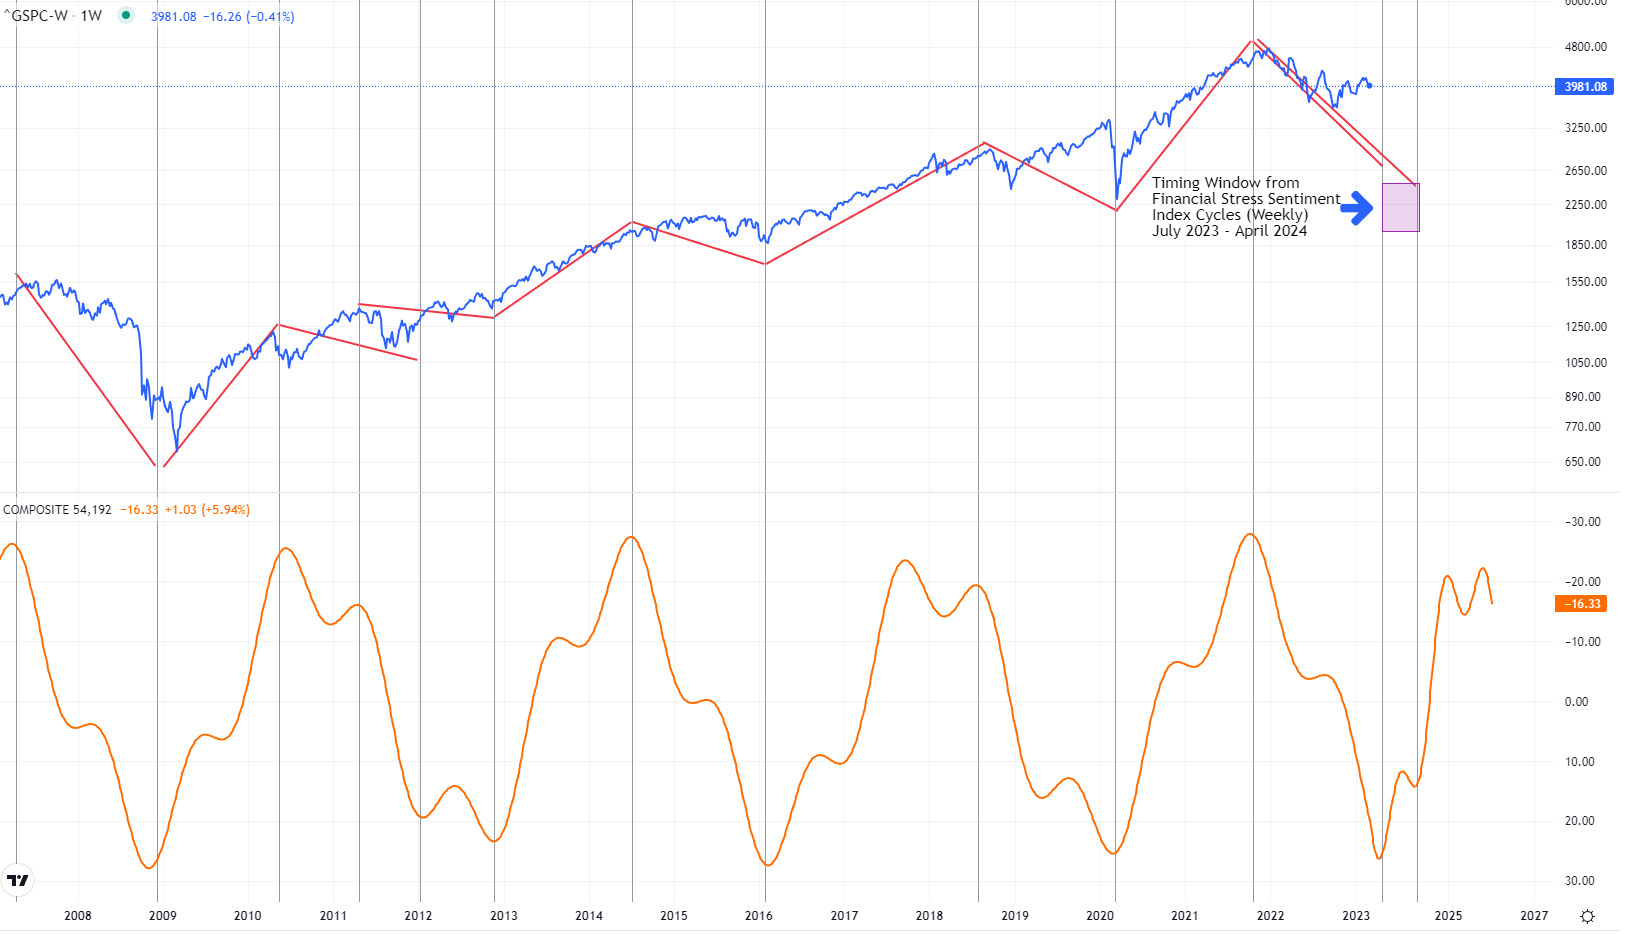
If we overlay the inverted cycle model from this dataset with the S&P weekly price series, we can observe nice correlation in changes in trend in the S&P weekly data at the turning points of the composite financial stress model.
» SPX vs. Financial Stress Composite Sentiment Cycle
Composite Cycle model taken from analyzing the St. Louis Fed Financial Stress Index (see above) mapped as inverted indicator shown at the bottom of the weekly SPX. Projecting major sentiment cycles top (hint: shown inverted as low) starting July 2023 to April 2024. So expecting a cycles sentiment stress top late summer 2023 / early 2024 which should correlate with a major global markets low.
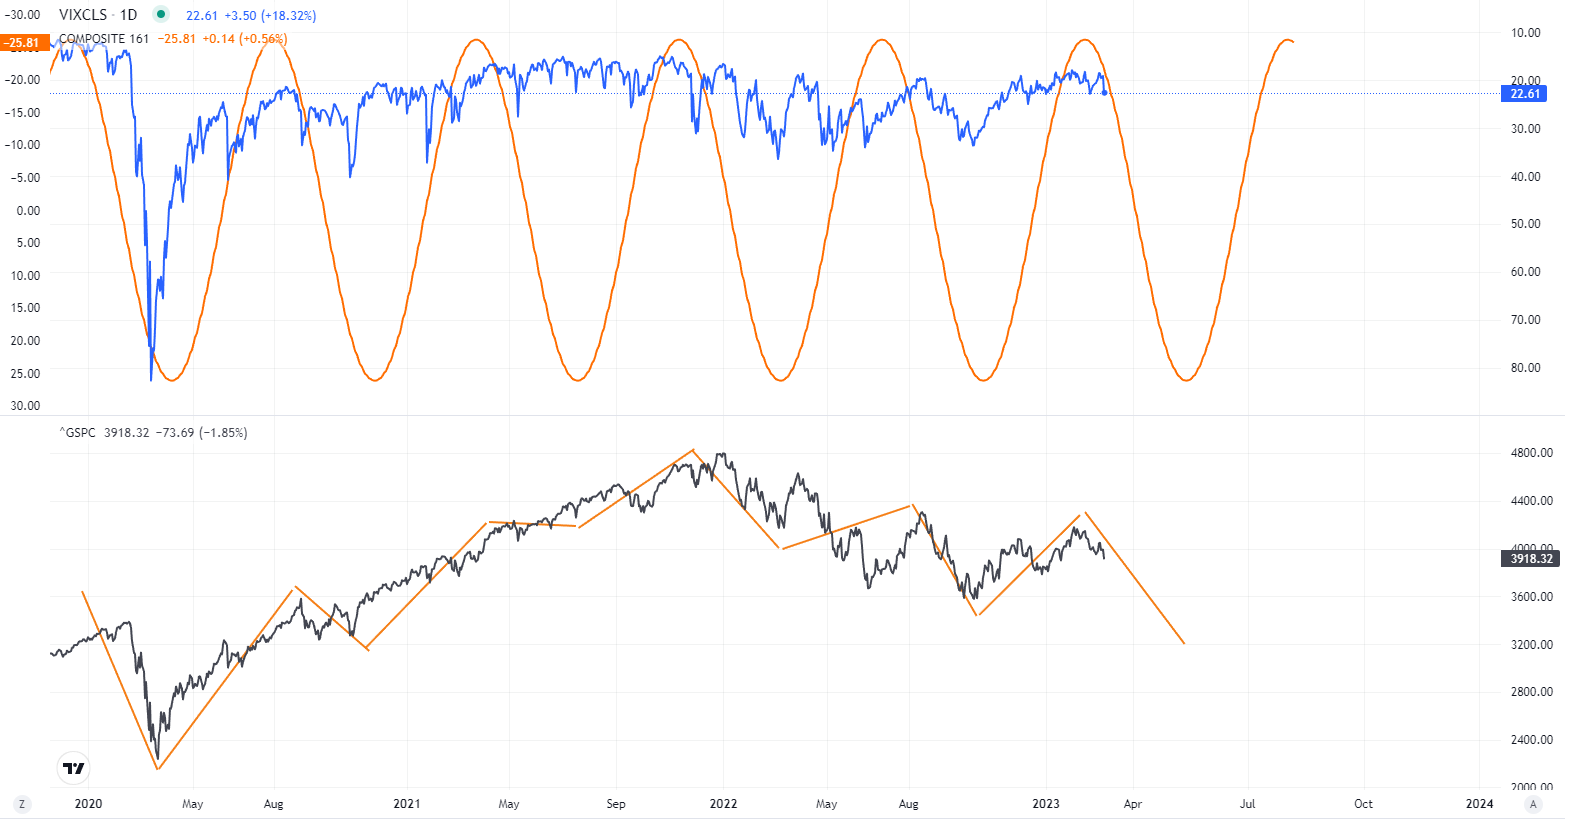
Last but not least, a more complex chart. Analysing the VIX index, we get a ~160 dominant daily cycle. As the VIX acts inverse to the S&P price series. Meaning that bottoms in the VIX correlate to price tops and vice versa. We show the inverted VIX and inverse dominant cycle on top and the S&P chart with highlighted cycle legs at the bottom.
This volatility, or “fear” cycle, has a nice rhythm with the price series. Showing also now the current cycle phase is giving a downward cycle to the price series.
In addition to that, we know that the generic character of the market changed since November 2021 from a bull to a bear market. We saw this also in the long term cycles model. Sayed that, we need now pay more attention to the “cycles within cycles” synchronization. Which means since November 2021 we should look out for cycles downward phases. You can see that until November 2021, the upward swings have been more valid as we have been in the bull long-term cycle until then. Finally, this adds just up another downward cycle to the mix.
» Personal audio commentary for subscribers can be found at the bottom
© 2023 marketcycles.blog, Lars von Thienen, All Rights Reserved.
Any reproduction, copying, or distribution, in whole or in part, is prohibited without permission from the publisher.
Information contained on this site is obtained from sources believed to be reliable, but its accuracy cannot be guaranteed. Lars von Thienen “marketcycles.blog” is a publisher of scientific cycle analysis results for global markets and is not an investment advisor. The published analysis is not designed to meet your personal circumstances – we are not financial advisors and do not give personalized financial advice. The opinions and statements contained herein are the sole opinion of the author and are subject to change without notice. It may become outdated and there is no obligation to update any such information.
Any projections, market outlooks or estimates herein are forward looking statements and are inherently unreliable. They are based upon certain assumptions and should not be construed to be indicative of the events that will occur.
Investments should be made only after consulting with your financial advisor and only after reviewing the prospectus or financial statements of the company or companies in question. You shouldn’t make any decision based solely on what you read here.
Neither the publisher, the author nor any of its affiliates accepts any liability whatsoever for any direct or consequential loss howsoever arising, directly or indirectly, from any use of the information contained herein.
» Personal audio podcast commentary
Keep reading with a 7-day free trial
Subscribe to Stock Market Cycles to keep reading this post and get 7 days of free access to the full post archives.