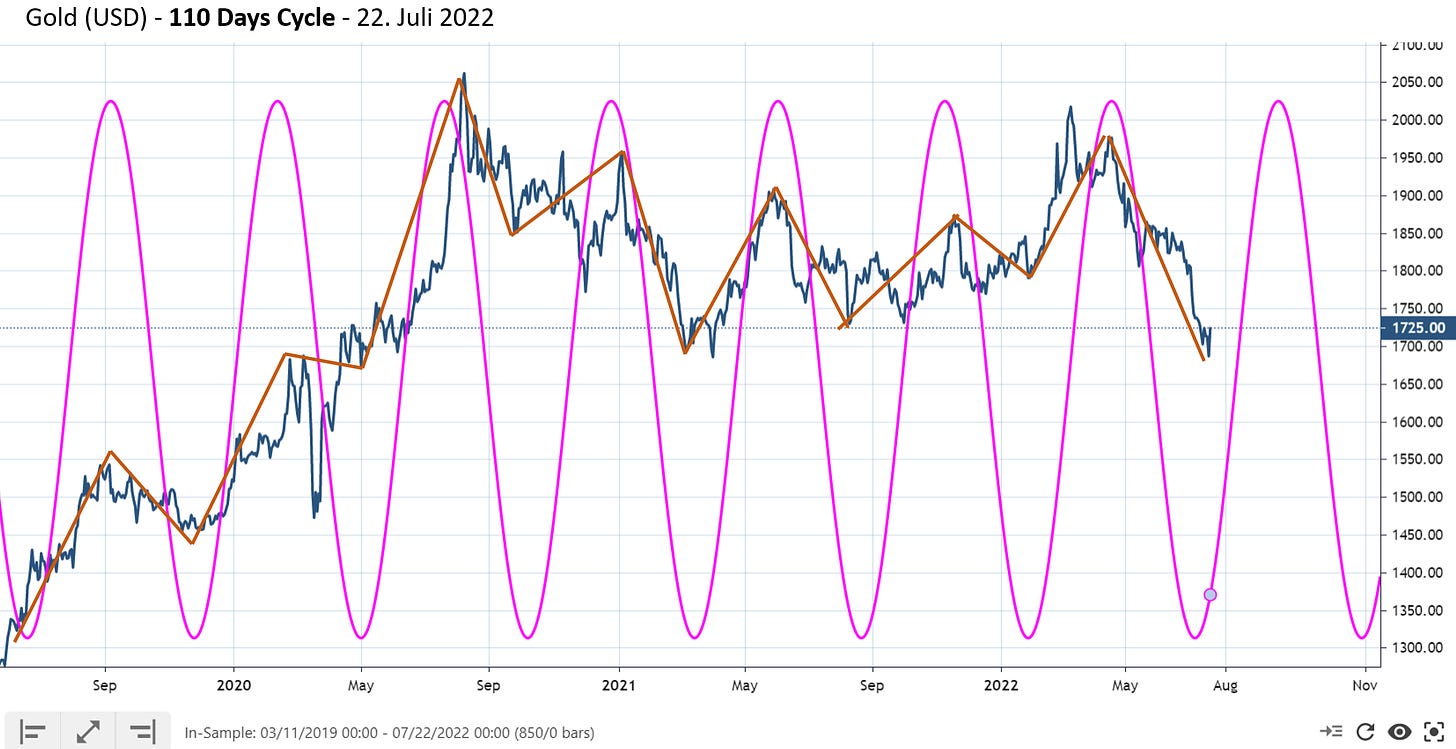
Two prevailing cycles in gold create an interesting situation for this summer: both the 110-day cycle and the 211-day cycle are now bottoming in the July-August period.
The following two charts show the gold price compared to the prevailing cycles, with trend reversals highlighted in red according to the cycle timing.
Gold 110 Days Cycle
Gold 211 Days Cycle
Keep reading with a 7-day free trial
Subscribe to Stock Market Cycles to keep reading this post and get 7 days of free access to the full post archives.


